Application Dependency Mapping: Critical to Ensuring Business Availability

In 2013, in a legal case that sent waves through the IT industry, Sears Holding Corp. filed lawsuits against two IT vendors involved in maintaining and providing equipment for the company’s data center. Sears alleged that, as a result of multiple power outages and ongoing issues, the company had lost an estimated $2.2 million in profits and another $2.8 million in repair costs. More recently, Salesforce.com experienced a day-long outage due to a firmware bug that cost the company $20 million and customers experienced critical loss of sales and customer data. While these cases may be extreme examples, they highlight potential costs that go with downtime and outages.
These scenarios are every engineer’s worst nightmare, as many have had the experience of being asked to troubleshoot an issue, replace a component or do some “routine” maintenance, only to end up with a cascade scenario where one issue leads to another. This can lead to a time-consuming, frustrating and costly game of whack-a-mole, trying to fix issues as they rear their ugly head. This situation underscores the need for application dependency mapping. To properly use it, you must first understand exactly what dependency mapping is, why it matters and the value it brings to your company.
Application Dependency Mapping: What It Is and Why Can It Be Difficult
In short, application dependency mapping is the process of diagramming out the components that make up an IT service. This includes the underlying storage, networks, and server infrastructure that communicate together to support an application service. It means finding and following any and all inter-dependencies between services and components, documenting them and knowing exactly how they impact each other.
While this may not seem difficult for smaller IT systems, the challenge comes when dealing with complex systems that have changed over time. As different engineers and administrators oversee services, expansions take place, IT personnel changes, and IT systems expand and increase in complexity, it can make it virtually impossible to manually map.
According to the 2017 State of the Network Engineer from NetBrain, the chief reason network engineers don’t diagram application dependencies is that the manual process takes too long. Thirty-five percent of respondents indicated that it took their teams a month or longer to generate an application dependency map.
This is where application dependency mapping tools come into play. Rather than tediously trying to manually map an IT service, dependency mapping software can automate and simplify “map” creation.
Why Mapping Matters
As the opening examples illustrate, in today’s litigious society, legal repercussions are an ever-increasing possibility when critical services and networks go offline. In addition, many service-level agreements (SLAs) have clauses that incorporate penalties or discounts for clients who experience unplanned downtime.
Even where there are no legal consequences to interrupted services and downtime, the cost—in terms of a company’s customer base—can be disastrous. According to a study by Akamai, 75% of customers who experience slow load times, freezes or crashes when shopping at a website will no longer buy from that site.
The evidence is clear: Pinpointing the cause of performance outages and bottlenecks is easier with a coherent view of underlying relationships of communicating devices. This speeds the ability of organizations to discover and resolve outages, minimizing consequences from these events.
Dependency Mapping: The Value It Adds to Your Company
In addition to avoiding costly outages, dependency mapping can proactively save companies time and money by improving efficiency. In today’s world of inter-connected services and applications, understanding and optimizing services is the key to being able to function smoothly and handling customer growth.
For example, a company may be experiencing poor network performance or cloud slowdowns. With traditional troubleshooting, network teams would need to painstakingly track down the issue, spending countless man-hours trying to find the cause of the problem. In contrast with application dependency mapping, IT staffs can quickly pinpoint problems by looking at the big picture. By seeing exactly how components and services are inter-connected, staffs can quickly identify bottlenecks, congestion points and design issues that can cut network troubleshooting to a fraction of the time.
Even more critical, dependency mapping can help you avoid problems and slowdowns altogether, or at least greatly reduce their likelihood. By having an accurate, up-to-date map of your network and cloud infrastructure, you can find problems before they come up, see areas where performance will likely slow down with additional growth and identify weak points in your infrastructure, services, and components that should be addressed before they reach a breaking point. This, in turn, helps your company target its upgrade and maintenance efforts where they really matter and where they will return the most value.
The VIAVI Advantage: Not all Application Maps Are Built the Same
 When it comes to application troubleshooting, dependency mapping is a vital tool in ensuring your company’s services are running at peak efficiency. Without it, your IT staff are consigned to painstakingly trying to track down issues. That being said, not all application dependency mapping technology is equal in capabilities and simplicity. When evaluating application dependency maps, key questions to ask and understand:
- How much setup and configuration time is required to use the maps?
- How does the map help engineers to identify real-time performance problems?
- How does the map integrate into a troubleshooting workflow?
- Can you review application dependency maps over time to identify potential changes?
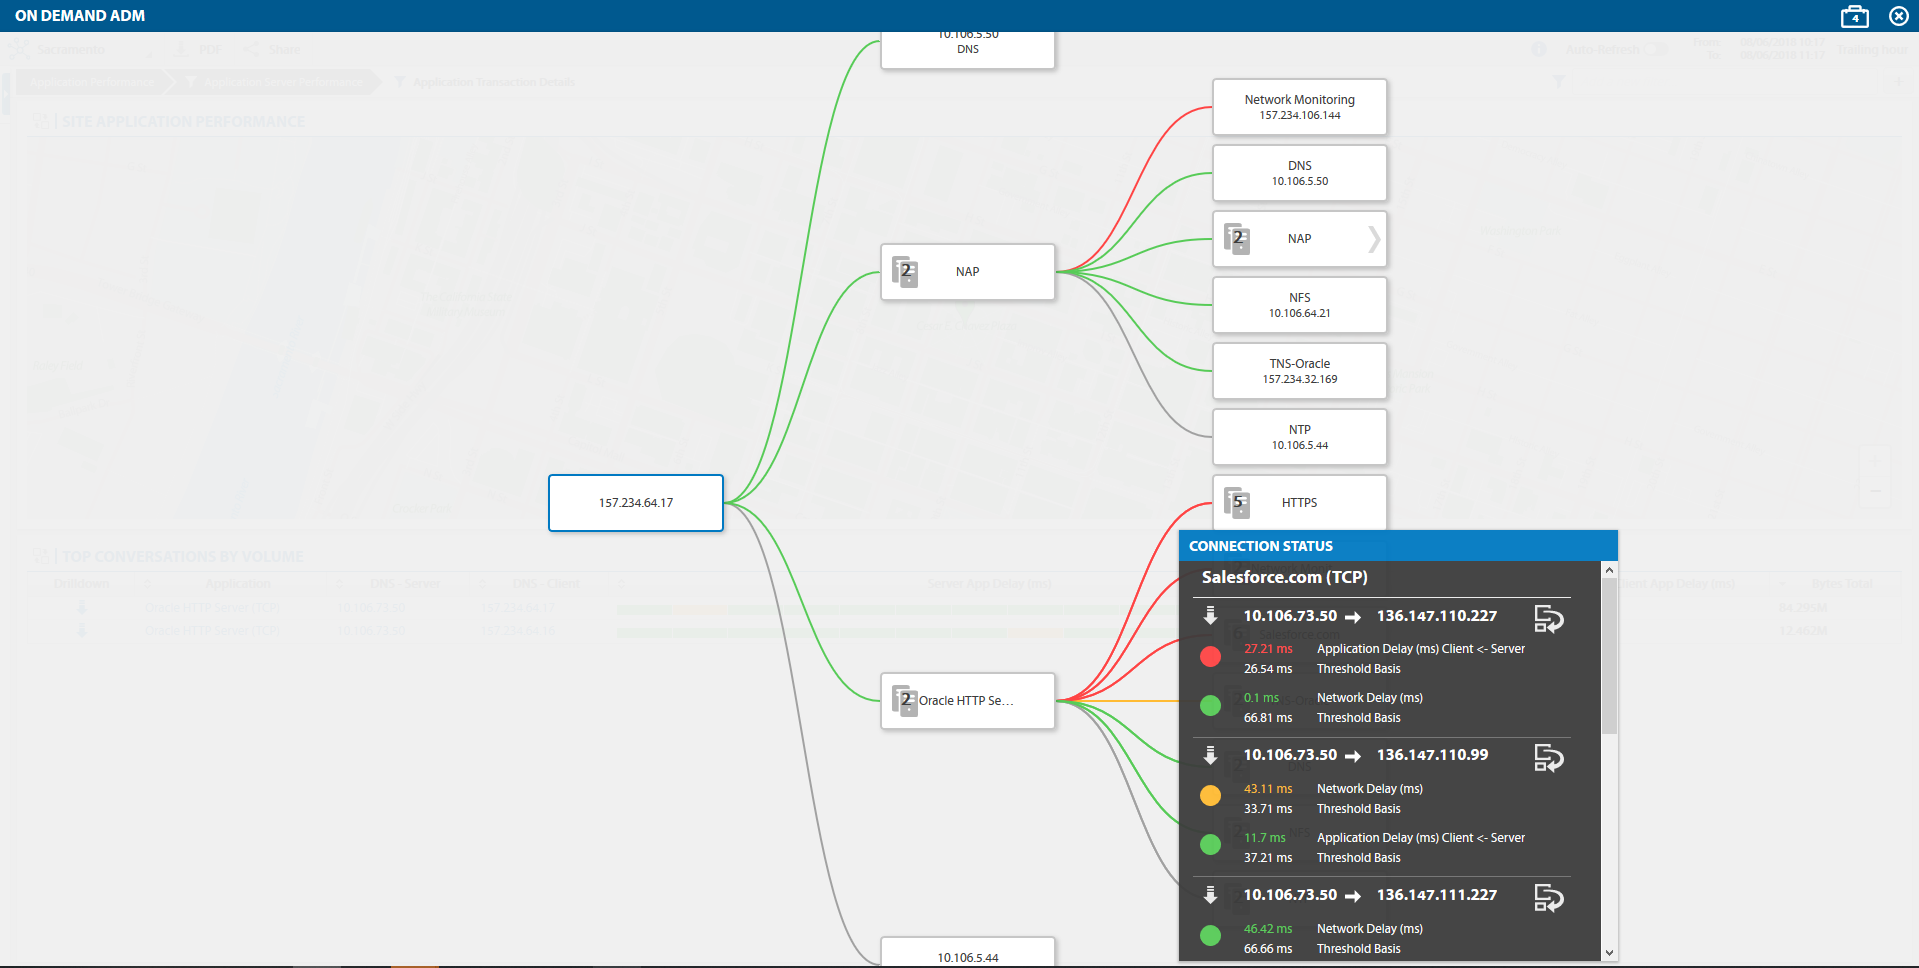
Within Observer Apex, application dependency mapping provides the ability to diagram the relationships between devices on demand. From this map which is rendered based on wire-data data analysis, performance between devices are benchmarked and abnormal and degraded performance indicated through red-yellow-green rating. As a part of default workflows, engineers can click on the device to perform root-cause analysis to identify the source of poor performance. To further explore the Observer On-Demand Application Dependency Mapping, view the following resources:
- 3 Minute Workflow Video: Troubleshooting Slow SQL Traffic
- Technical Note: Application Dependency Mapping
—
Additional Resources:


