Reinforcing the Pillars of Observability

Reinforcing the Pillars of Observability
The Greek Parthenon is known for the seventeen distinctive marble pillars enveloping the structure. These sturdy columns have remained intact despite over two thousand years of earthquakes, war, looting, and fire. With a slightly less auspicious origin story, the three pillars of observability (logs, metrics, and traces) continue to serve their intended purpose as network data sources.
SecOps teams, network engineers, and network architects can only deliver next-level performance management when they continually adapt to new topologies and mine new data sources. With that in mind, practices that proactively shed light on complex cloud and hybrid cloud network performance must do more than stand the test of time as they iterate to remove blind spots and reduce mean time to resolution (MTTR).
Telemetry modes fortify the three pillars
Each of the traditional pillars represents a form of telemetry, which is the process of gathering performance data and communicating it to a remote location for monitoring and analysis. Telemetry practices are often associated with space vehicles and hospital equipment that continually transmit vital information over the airwaves. Network telemetry supports observability through a combination of:
-
- Logs: Time-stamped records of network activity generated by systems, applications, and devices that include useful IP address, port, protocol, packet quantity, and traffic decision data.
- Metrics: Numerical values collected to assess network behavior, trends, and KPIs. Values like throughput, packet loss, and bandwidth usage are among the more commonly collected metrics.
- Traces: End-to-end maps of the path traversed during each network request. Traces provide valuable information on the services involved and the path followed while making it easier to diagnose performance issues and bottlenecks.

Rebuilding the Pillars with Precision Visibility
The pillars have remained constant as the collection, analysis, and automation processes supporting them have continued to advance. New analysis methods and previously untapped data sources are redefining the pillars by removing blind spots and improving the granularity of each telemetry method while placing the focus on the metrics that matter most.
Logs to fill in the blanks
Network flow logs, system logs, and device logs are extremely valuable digital records that describe transactions and interfaces to provide visibility into network behavior and errors. The best network monitoring solutions can condense mountains of unstructured network, infrastructure, and user data into enriched-flow records to enhance visibility all the way to the device level.
The Microsoft Azure cloud environment can present visibility challenges, with no native support for packet capture. This leaves network security group (NSG) flow logs as a viable option for improved Azure access. These detailed logs contain important IP, port, protocol, and packet information along with time-stamped traffic details. Monitoring methods capable of ingesting and analyzing NSG flow logs prevent Azure cloud environments from becoming network blind spots.
Fewer metrics, more clarity
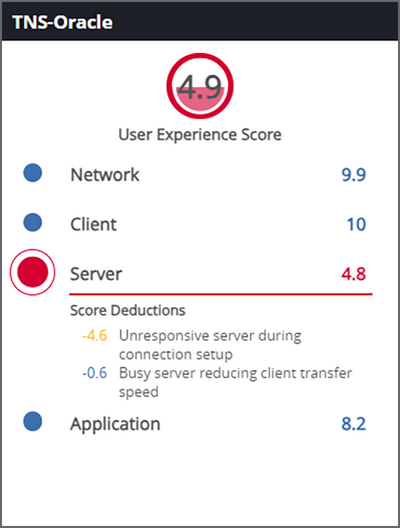
There is no shortage of metrics available, but the path to next-level performance management is all about knowing which metrics to monitor, and how to interpret them. Considering the end-user experience above all is a prudent metric prioritization strategy. End-user experience (EUE) scores based on the most important KPIs help to streamline network performance monitoring practices. For network engineers and helpdesk teams, precision visibility comes in the form of EUE scores prioritized by domain (Network, Client, Server, and Application) to expedite root cause and issue resolution.
Metrics like SSL certificate expiration and cipher suite usage are also important for maintaining compliance, security, and performance, but can be difficult to gather through traditional monitoring practices. The metrics pillar is further reinforced through automated analysis designed to prevent SSL/TLS certificate expirations and insecure sessions from going unnoticed to proactively update certs before they expire and verify cipher suite adherence.
Traces provide a roadmap to success

Traces allow network engineers to map and visualize the path of individual requests from end-to-end to better understand the infrastructure, resources, and hops included between network or process boundaries. Traces also integrate the time element associated with each request to help diagnose delays and bottlenecks and reveal which network elements are contributing to problems.
Unified Communications (UC) platforms have become an essential enabler of remote working as they provide a consistent experience across integrated voice, video, and messaging channels. The best network performance monitoring solutions leverage available data to trace individual VoIP calls through the infrastructure that carried the call. When supported by direct packet access, UC interactive call details make it faster and easier to locate and diagnose the sources of call degradation.
What about deep packet inspection (DPI)?
There’s a reason packets are referred to as the ultimate source of network truth. Is DPI the fourth pillar of observability? The data within packets produces an unaltered record complete with detailed traffic, application, and error information. Deep packet inspection provides the granularity needed to differentiate between important applications like Outlook and unwanted or low priority traffic. When combined with flow data, metrics, and traces, packet inspection provides precision visibility to eliminate blind spots and accelerate MTTR.
Pillars that Stand the Test of Time
The Parthenon restoration project that began in 2019 included rebuilding existing structures and adding ninety new structural elements. In the same way, the pillars of observability are most useful when best practices are strengthened by new ideas and technologies. Deep packet inspection, UC interactive call details, and NSG flow log ingestion are among the new features and data sources currently pushing the boundaries of observability. This trend will continue as newly discovered blind spots are countered by improved cloud access and predictive analytics.
The VIAVI Observer Platform incorporates capabilities like certificate analysis and machine learning powered EUE scoring to strengthen the pillars while dislodging more of the visibility burden from busy NetOps and SecOps teams. Efficient workflows and intuitive dashboards fueled by three-dimensional data sources help to satisfy business goals while effectively overcoming IT, resource, and security challenges throughout the network lifecycle.
Learn more: viavisolutions.com/enterprise


