Best Practices: Fiber Deployment in Wireless Networks (Pt. 2)
Part 2 of the Evolution of Fronthaul Networks (read Part 1: Intro to Fronthaul and Part 3: CPRI )
As we learned in part 1, fiber deployment permits the placement of RRH’s closer to the antenna. Also known as light radio, this RRH placement has significantly improved the energy efficiency of cellular networks as the number of RRH’s continued to rise drastically with 4G densification projects over the recent years. Part 2 focuses on best practices for fiber deployment. We will check into the next protocol layer, Common Public Radio Interface (CPRI), in part 3.
Deployment of fiber needs to be accompanied by proper test procedures. Optical fiber connectors can easily be contaminated. The effects of contamination might be visible in some cases, but may also lead to marginal errors that cause errors after service commissioning. These errors can become costly as they are not always easily identified as connector contamination. The cost factor will become more significant if the contamination occurs at the RRH on the tower, and necessitates costly tower climbs by certified crew. Therefore, it is a good practice to clean the optical connector before any connection. Now, how do we know that the connector is clean? Fortunately, there are tools that allow us to visualize any dirt present on the fiber surface, and, furthermore, they automatically provide a pass/fail verdict based on the amount and the location of contamination on the core or periphery. In summary, clean your connectors and always “Inspect Before You Connect.”

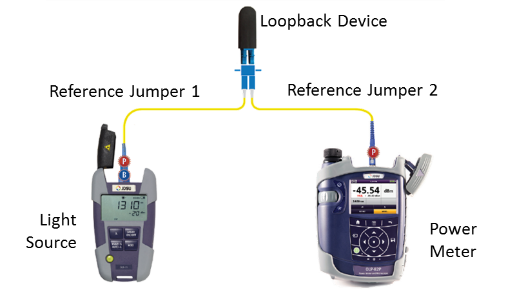
Cleaning fiber connectors is the first step in ensuring proper transmission of light from optical transceivers at the BBU to RRH. At a typical site, we can see anywhere from a few to dozens of fiber pairs that are bundled and routed to higher elevations on a tower or through building risers to roof tops. The bundling and bending of fibers can lead to marginal or permanent defect conditions including macrobends and microbends. They introduce signal or power loss. Another good practice involves optical reference loss measurements. By placing a light source and power meter at one end, and connecting a loopback device at the other end of the fiber, one can easily identify errors related to fiber bends or breaks.
If our optical reference measurement fails, we can attempt to use a visual fault locator (VFL) to detect any fiber bends that are nearby. Most of our fiber deployment is, however, not easily visible from the bottom of the tower. Optical Time Domain Reflectometer (OTDR) is a well-known technology that helps determine the location of fiber faults. Modern OTDRs are highly accurate and easy to use, reducing the chance of misinterpretation of OTDR traces.

The low power dissipation feature of fiber technologies has fueled two new applications in cellular networks: Centralized Radio Access Networks (C-RAN) and Distributed Antenna Systems (DAS). They involve placing the BBUs in a centralized location that can be several miles away from RRH’s. Whereas initial C-RAN projects deployed dark fiber, increasing number of projects consider using Wavelength Division Multiplexing (WDM) technology that enables much more efficient use of precious fiber infrastructure. It uses a multiplexer/demultiplexer pair to merge/split several signals into a fiber connection. The signals terminate at multiple transponders that operate at different optical wavelengths. The location and spacing of the wavelengths are dependent on the type of transponder technology and determines the scalability of the system. Coarse WDM (CWDM) typically deploy wavelengths from 1270 nm to 1610 nm with a channel spacing of 20 nm. With newer fibers (compliant to G.652.C/D), CWDM systems can support up to 18 end points. CWDM transponders are not cooled in operation, thus temperature variations can cause a drift of the central wavelength. Therefore, each CWDM should be checked for possible wavelength shorts or power loss with an optical channel checker.

The increasing use of C-RAN architectures and densification of cell sites have driven the need to transport ever larger number of wavelengths on optical fiber infrastructure. Dense Wavelength Division Multiplexing (DWDM) is developed to take advantage of capabilities of Erbium Doped Fiber Amplifiers (EDFA) to carry large number of channels over larger distances. It uses C-Band (1525-1565 nm) or L-Band (1570-1610nm) bands. Wavelength spacing is much tighter in DWDM compared to CWDM, therefore it requires precision temperature control of the transmitters. They are mainly deployed in backbone networks, but there is an emerging application for DWDM in fronthaul networks. Proper network deployment necessitates characterization of wavelengths frequencies and power levels. DWDM optical channel checkers scan the channels, and automatically record their wavelengths/frequencies and respective power levels.
Contaminated optical connectors, micro/macrobends, malfunctioning and incorrect transponder configurations cause significant problems in fronthaul network deployments. Cost of errors are high due to cost of network outage and possible need for tower climbs. Fiber inspection, power measurement, wavelength verification and optical time domain reflectometry are essential practices that ensure that the job is done right first time.
Reference: Deploying Reliable Fiber-to-the-Antenna Networks
If you would like to read more, please read my white paper, The Evolution of Fronthaul Networks.
Part 2 of the Evolution of Fronthaul Networks (read Part 1: Intro to Fronthaul and Part 3: CPRI )