Taking the Work out of Workflows – Part II: Performance Management

When faced with validating and resolving a performance problem with a complex application, we need complete visibility into how the various components of the application are performing. The way most vendors approach this need is to deliver Key Performance Indicators (KPIs) that describe how each of the various elements of the system is performing. Having KPIs is a good thing, but is analyzing and correlating numerous KPIs the most efficient way of getting to the root cause? Consider:
- Volume. Some tools tout the fact that they provide hundreds or even thousands of KPIs. However, too much information can actually Kill Problem Identification. We don’t just need numbers, we need…
- Context. Simply knowing that a particular resource is currently at xx% utilization isn’t enough. We need to know how that resource is typically utilized in order to know whether or not the current number is relevant.
- Completeness of information. With ever-increasing data volumes, many tools are struggling to keep up. You can’t accurately analyze or visualize data you never captured.
What’s needed isn’t just KPIs or all the raw data. What’s needed is the automated intelligence to analyze that information and transform it into something clear, concise, and actionable. We need information that allows us to get to answers, not just data that forces us into more research or evaluation.
Let’s look at an example of how having forensic level data, combined with automated analysis and optimized workflows can help us become far more efficient in both identifying and resolving performance problems.
Step 1: Automated Analysis
In this Site Performance view, we see how each of our defined sites has been performing and how they are performing right now. What you see is a single number (5.5) combined with a problem domain and description (network delays and retransmissions). What you didn’t see was the capture of every packet, the systematic analysis of every socket connection, the intelligent consolidation and translation of dozens of KPIs into a single score — one actionable value and a description and proof of where the problem lies.
Let’s just let that sink in for a minute…
These top-level views of Site and Application performance tell us how critical services are behaving and the End User Experience (EUE) that’s being delivered. In other words, they tell us how our business is operating. Now let’s put this information to work.
Step 2: Focus
Our attention shifts now to one site, and the network performance and utilization. Automatic baselines inform us that a WAN interface is seeing unusually high utilization.
Focusing on that one interface allows us to see the traffic distribution and identify the fact that our Document Archive application is consuming an unexpectedly large amount of bandwidth.
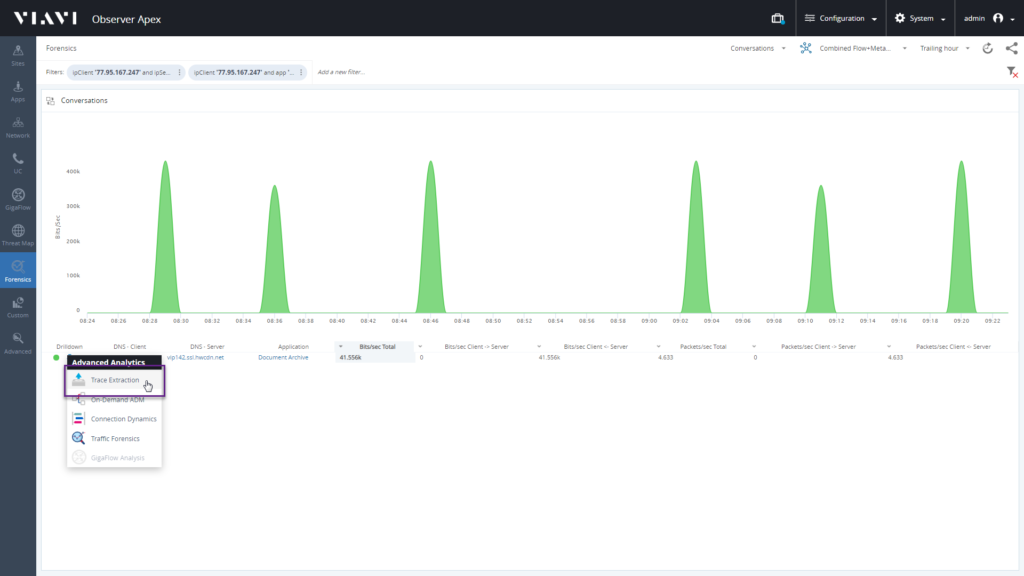
Drilling down to the traffic forensics for this application shows us every client that’s using this application and the amount of data they are transmitting.
What if we need even more detail? Let’s take a single user and export just the packets associated with their use of this application.
What have we illustrated in this example?
- The benefits of using automated intelligence to identify that a performance problem is occurring, along with scope and severity – We have one site that’s experiencing a moderate degradation in the end-user experience.
- The importance of translating autonomous KPIs and raw data into actionable information – this is a network problem.
- The value of marrying that actionable information with simple, efficient workflow – we went from identification to forensic-level analysis in a few clicks, led by just the KPIs that matter.
- Ease of use – virtually any member of our team could see and understand the issue and literally go from the map to the packets if needed. Our helpdesk can validate the issue and accurately assign and prioritize it. If our Tier 3 analyst needs to get involved, they have a clear problem description and only the raw data needed for resolution.
- The value of seamlessly unifying disparate data. In this example, our workflow started with a packet-based EUE score, moved through fully integrated flow data (NetFlow, IPFIX, etc.), and ended up back at the packets. But there was no need to figure out which data source to look at and how to obtain just the relevant packets and flows.
You might already have access to all the right data. However, maybe it’s time to revisit how to best put it to work for you and your organization. The right workflow will have less work and more flow. Take a look at the latest release of VIAVI Observer Platform and discover how to make sure you have the right data available at your fingertips.


